What You'll Learn
Hosts and services can be monitored in two ways:
- Use of Simple Host Monitoring (Agentless): This involves the use of services that are accessible across the local network or the Internet for example include HTTP, SSH, ICMP etc. This method is fit for monitoring hosts on which monitoring agents cannot be installed.
- Use of Monitoring Agents (Agentbased): In this method, an agent is required in order to monitor host and services like CPU load, disk space, memory and the running process. In this configuration, Icinga 2 acts as the master node and the remote host acts as the client node.
In this codelab you will learn
- how to monitor the availability (=state) of hosts and services agentless with Icinga2
Hosts and services can be anything such as Network services (HTTP, SSH, etc.), printers, switches or routers, or any other local or network-accessible services. Icinga2 monitors the states of hosts and the services they offer. Each host can have the states UP and DOWN, each service can have the states OKAY, WARNING, CRITICAL and UKNOWN.
Where You Can Look Up
The best source of documentation is the homepage of Icinga2. The latest documentation can be found here.
What You'll need
Icinga2 instance
You need a working Icinga2 instance that you can access via IcingaWeb2 GUI. If you do not have a running Icinga2 instance, please consult the Codelab BITI IPM Lab - Icinga Installation how to install Icinga2 on your local computer.
Guest operation system (Guest OS)
This is the OS of the virtual machine. This will be Debian .
Administators privileges
By default, administrator privileges are required on the Host OS to install additional software. Make sure that you have the required permissions.
For the Guest OS, you will create and manage your own users. These users will therefore be different from the Host's user administration.
Root privileges via sudo
In this codelab you have to work with root privileges. Therefore, a few words of caution: double check whatever you type and make backups whenever necessary.
Working with root privileges is quite easy. Open a terminal (a shell) and enter the following commmand:
sudo -s
Enter the password of the icinga user and voila:
root@server:/home/icinga#
Once you are root via sudo, it is no longer necessary to prepend the sudo command. Instead of sudo ls -lisa /root/ you can also type ls -lisa /root/ because you have root privileges already. However, all commands in this codelab will always start with sudo to remind you that you are working with root privileges.
Stop Icinga2 service
In this codelab we need to reconfigure Icinga2. First, stop the Icinga2 service with the following command:
sudo systemctl stop icinga2
Next, check the status of the service with the following command:
sudo systemctl status icinga2
The output should look as this:
  icinga2.service - Icinga host/service/network monitoring system
     Loaded: loaded (/lib/systemd/system/icinga2.service; enabled; vendor prese>
     Active: inactive (dead) since Wed 2021-12-03 15:02:38 CET; 2s ago
       Docs: https://icinga.com/docs/icinga2/latest/
    Process: 796 ExecStartPre=/usr/lib/icinga2/prepare-dirs /usr/lib/icinga2/ic>
    Process: 818 ExecStart=/usr/sbin/icinga2 daemon -e ${ICINGA2_ERROR_LOG} (co>
   Main PID: 818 (code=exited, status=0/SUCCESS)
        CPU: 3.256s

Dec 03 15:02:38 server icinga2[1131]: [2021-12-03 15:02:38 +0100] information/D>
Dec 03 15:02:38 server icinga2[1131]: [2021-12-03 15:02:38 +0100] information/I>
Dec 03 15:02:38 server icinga2[1131]: [2021-12-03 15:02:38 +0100] information/I>
Dec 03 15:02:38 server icinga2[1131]: [2021-12-03 15:02:38 +0100] information/D>
Dec 03 15:02:38 server systemd[1]: Stopping Icinga host/service/network monitor>
Dec 03 15:02:38 server icinga2[1131]: [2021-12-03 15:02:38 +0100] information/C>
Dec 03 15:02:38 server icinga2[1131]: [2021-12-03 15:02:38 +0100] information/I>
Dec 03 15:02:38 server systemd[1]: icinga2.service: Succeeded.
Dec 03 15:02:38 server systemd[1]: Stopped Icinga host/service/network monitori>
Dec 03 15:02:38 server systemd[1]: icinga2.service: Consumed 3.256s CPU time.
Note that the status Active must be inactive (dead) since XXXXXX. Press q to end the output.
Config.d directory
The basic Icinga2 installation provides sample files for monitoring the local server. All files can be found in the following directory:
sudo ls -al /etc/icinga2/conf.d/
The ls -al command displays the following configuration files in detail:
drwxr-x--- 2 root   root   4096 Dec  7 14:15 .
drwxr-x--- 9 nagios nagios 4096 Dec  7 14:19 ..
-rw-r--r-- 1 root   root     35 Dec  7 14:15 app.conf
-rw-r--r-- 1 root   root    114 Dec  7 14:15 apt.conf
-rw-r--r-- 1 root   root   5297 Dec  7 14:15 commands.conf
-rw-r--r-- 1 root   root    542 Dec  7 14:15 downtimes.conf
-rw-r--r-- 1 root   root    638 Dec  7 14:15 groups.conf
-rw-r--r-- 1 root   root   1500 Dec  7 14:15 hosts.conf
-rw-r--r-- 1 root   root    793 Dec  7 14:15 notifications.conf
-rw-r--r-- 1 root   root   2131 Dec  7 14:15 services.conf
-rw-r--r-- 1 root   root   2060 Dec  7 14:15 templates.conf
-rw-r--r-- 1 root   root    732 Dec  7 14:15 timeperiods.conf
-rw-r--r-- 1 root   root    308 Dec  7 14:15 users.conf
The samples can be very helpful if you want to gain an insight into the structure of the configuration files. However, as we want to set up our own files here, the sample files are not required for our codelab. Let's start from scratch.
How to backup
The easiest way is to move the configuration files to another folder. Run the following commands to backup the Icinga2 config files:
sudo cd /etc/icinga2
sudo mv conf.d/ conf.d.backup/
sudo mkdir conf.d/
sudo chown -R nagios:nagios conf.d
To summarize, the sequence simply renames the source directory (conf.d -> conf.d.backup) and creates a new directory (conf.d). Finally, the ownership of the user nagios is completely transferred to the config.d directory. This will be our working directory from now on. All sample files are now in the backup directory and can be restored if required. You can check this with the following command:
root@server:/etc/icinga2/conf.d# sudo ls -la /etc/icinga2/conf.d.backup/
total 56
drwxr-x--- 2 root   root   4096 Dec  7 14:15 .
drwxr-x--- 9 nagios nagios 4096 Dec  7 14:19 ..
-rw-r--r-- 1 nagios nagios   35 Dec  7 14:15 app.conf
-rw-r--r-- 1 nagios nagios  114 Dec  7 14:15 apt.conf
-rw-r--r-- 1 nagios nagios 5297 Dec  7 14:15 commands.conf
-rw-r--r-- 1 nagios nagios  542 Dec  7 14:15 downtimes.conf
-rw-r--r-- 1 nagios nagios  638 Dec  7 14:15 groups.conf
-rw-r--r-- 1 nagios nagios 1500 Dec  7 14:15 hosts.conf
-rw-r--r-- 1 nagios nagios  793 Dec  7 14:15 notifications.conf
-rw-r--r-- 1 nagios nagios 2131 Dec  7 14:15 services.conf
-rw-r--r-- 1 nagios nagios 2060 Dec  7 14:15 templates.conf
-rw-r--r-- 1 nagios nagios  732 Dec  7 14:15 timeperiods.conf
-rw-r--r-- 1 nagios nagios  308 Dec  7 14:15 users.conf
In the next section, we can now create our own configuration structure. Follow me.
First, we create two template files: a host and a service template. Template files contain basic settings and can be imported by provided configuration files.
templates.conf
The templates.conf file contains basic settings for monitoring hosts (e.g. servers) and services (e.g. HTTP service, SSH service).
First, create an empty file with the corresponding ownership:
sudo touch /etc/icinga2/conf.d/templates.conf
sudo chown nagios:nagios /etc/icinga2/conf.d/templates.conf
Next, open the file with an editor:
sudo nano /etc/icinga2/conf.d/templates.conf
Next, copy the following content in to the template file:
template Host "generic-host" {
  max_check_attempts = 3
  check_interval = 5m
  retry_interval = 150s
}

template Service "generic-service" {
  max_check_attempts = 3
  check_interval = 1m
  retry_interval = 30s
}
Where,
template- the key wordHostorService- template type (type can be Host, Service, User, Period, etc.)generic-hostorgeneric-service- one unique name for each template sectionmax_check_attempts- specifies how often a check may fail before a reaction is triggeredcheck_interval- specifies after how many minutes/seconds a check should be repeated if no failures occurretry_interval-specifies after how many minutes/seconds a check should be repeated if failures occur
Quit the configuration file with CTRL-X and confirm with y to save all changes.
Commands.conf
The file commands.conf contains information on how check_commands are triggered by Icinga2. Since Icinga2 has a lot of check_commands, simply restore the commands.conf file from the backup directory and we are done here.
sudo cp /etc/icinga2/conf.d.backup/commands.conf /etc/icinga2/conf.d/commands.conf
sudo chown -R nagios:nagios /etc/icinga2/conf.d
Check for completeness
At this point, let's see what we have. Run the following command:
sudo ls -al /etc/icinga2/conf.d/
The output must look like this:
total 24
drwxr-x--- 2 root   root   4096 Dec  7 14:15 .
drwxr-x--- 9 nagios nagios 4096 Dec  7 14:19 ..
-rw-r--r-- 1 nagios nagios 5297 Dec  7 14:15 commands.conf
-rw-r--r-- 1 nagios nagios 2060 Dec  7 14:15 templates.conf
Check whether the files commands.conf and templates.conf exist. If not, delete everything in this directory and start again from the beginning.
The hosts.conf file defines the configuration for all monitored hosts and servers. However, managing all hosts in a single file is difficult to maintain. For this, we will create a new folder in which we will define several config files.
For this codelab, we will create the following host files:
localhost.conf- the GuestOShost_os.conf- the HostOS
Note that we will not install monitoring agents on the HostOS system (e.g. your PC or laptop). Instead, we use a simple approach to monitor the HostOS system, better known as Agentless Monitoring. This approach is used when the installation of agents on the target system is not possible.
localhost.conf
We start by monitoring our GuestOS system localhost.
First, create the directory for our hosts.
sudo mkdir /etc/icinga2/conf.d/hosts/
Next, create the file localhost.conf.
sudo touch /etc/icinga2/conf.d/hosts/localhost.conf
Next, open the file with an editor of your choice (here: nano):
sudo nano /etc/icinga2/conf.d/hosts/localhost.conf
Next, copy the following content:
object Host "localhost"{
  import  "generic-host"
  address = "127.0.0.1"
  check_command = "hostalive"
}

object Service "ping4" {
  import  "generic-service"
  host_name = "localhost"
  check_command = "ping4"
}

object Service "swap"{
  import  "generic-service"
  host_name = "localhost"
  check_command = "swap"
}

object Service "load"{
  import  "generic-service"
  host_name = "localhost"
  check_command = "load"
}

object Service "ssh"{
  import  "generic-service"
  host_name = "localhost"
  check_command = "ssh"
}
Let's stop here to analyze the content:
object Host "localhost"{
  import  "generic-host"
  address = "127.0.0.1"
  check_command = "hostalive"
}
In this section we define a host object with the name localhost (to keep it simple). This is our target host. This object imports the generic-host template (which we created earlier) with all the default settings. We also specify the IP address of our target host. Since we plan to monitor our local machine, we simply use the IP address of the loopback device (127.0.0.1). Finally, we define the first check command (here: hostalive).
The example above also creates four (4) services: ping4, swap, load and ssh. All services refer to the target host localhost. Each service also specifies the corresponding check commands such as ssh or load which is triggered by Icinga2.
So far, so good ?
Exit the editor with CTRL-X. Confirm with y to save all changes.
host_os.conf
This section shows you how to monitor your HostOS system without using monitoring agents.
We use the same directory structure (/etc/icinga2/conf.d/hosts/) as in the previous section.
First, create the file host_os.conf.
sudo touch /etc/icinga2/conf.d/hosts/host_os.conf
Next, open the file with an editor:
sudo nano /etc/icinga2/conf.d/hosts/host_os.conf
Next, copy the following content in to the host_os.conf file:
object Host "host_os"{
  import  "generic-host"
  address "<ip-address of the hostos>"
  check_command = "hostalive"
}

object Service "ping4" {
  import  "generic-service"
  host_name = "host_os"
  check_command = "ping4"
}
In this section we define a host object with the name host_os (to keep it simple). This is our remote target host. This object imports the generic-host template (which we created earlier) with all the default settings. We also specify the IP address of our target host. Since we plan to monitor a remote machine, we simply use the IP address of your HostOS (e.g. your laptop). Finally, we define the first check command (here: hostalive).
The example above also defines a ping4 services which refers to the target host host_os. This service also specifies the corresponding check command which is triggered by Icinga2.
So far, so good ?
Exit the editor with CTRL-X. Confirm with y to save all changes.
Finally, transfer the ownership to all files and subdirs:
sudo chown -R nagios:nagios /etc/icinga2/conf.d
Check for completeness
Let's see what we have so far. Run the following list command:
sudo ls -al /etc/icinga2/conf.d/hosts/
The output must look like this:
drwxr-xr-x 2 root   root   4096 Dec  8 20:59 .
drwxr-x--- 3 nagios nagios 4096 Dec  8 20:59 ..
-rw-r--r-- 1 nagios nagios  196 Dec  8 20:59 host_os.conf
-rw-r--r-- 1 nagios nagios  440 Dec  8 20:58 localhost.conf
Check whether the files host_os.conf and localhost.conf exist and all owwerships are set correctly. If not, delete everything in this directory and start again from the beginning.
Test the configuration
Before restarting the Icinga2 service, it is a good idea to validate the configuration files. We can do this with the following command:
sudo icinga2 daemon -C
The parameter -C checks the config and issues an error message if the syntax is incorrect. Here's an example:
[2021-12-03 15:49:12 +0100] information/cli: Icinga application loader (version: r2.12.3-1)
[2021-12-03 15:49:12 +0100] information/cli: Loading configuration file(s).
[2021-12-03 15:49:12 +0100] critical/config: Error: syntax error, unexpected T_STRING
Location: in /etc/icinga2/conf.d/hosts/hostos.conf: 3:11-3:25
/etc/icinga2/conf.d/hosts/host_os.conf(1): object Host "host_os" {
/etc/icinga2/conf.d/hosts/host_os.conf(2):   import "generic-host"
/etc/icinga2/conf.d/hosts/host_os.conf(3):   address "192.168.0.188"
                                                    ^^^^^^^^^^^^^^^
/etc/icinga2/conf.d/hosts/host_os.conf(4):   check_command = "hostalive"
/etc/icinga2/conf.d/hosts/host_os.conf(5): }

[2021-12-03 15:49:12 +0100] critical/cli: Config validation failed. Re-run with 'icinga2 daemon -C' after fixing the config.
The output shows that there is an error in the file host_os.conf. The line 3 is marked with wavy line, indicating that something is wrong here. Experts like you immediately recognize that the equal sign (=) between the string address and 192.168.0.188 is missing. After fixing this typo (sorry for that), lets run the command again:
sudo icinga2 daemon -C
The output now lists an overview of all configuration files and instantiated configuration items, indicating that we are fine here.
[2021-12-03 15:48:00 +0100] information/cli: Icinga application loader (version: r2.12.3-1)
[2021-12-03 15:48:00 +0100] information/cli: Loading configuration file(s).
[2021-12-03 15:48:00 +0100] information/ConfigItem: Committing config item(s).
[2021-12-03 15:48:01 +0100] information/ConfigItem: Instantiated 1 NotificationComponent.
[2021-12-03 15:48:01 +0100] information/ConfigItem: Instantiated 1 IdoMysqlConnection.
[2021-12-03 15:48:01 +0100] information/ConfigItem: Instantiated 1 CheckerComponent.
[2021-12-03 15:48:01 +0100] information/ConfigItem: Instantiated 3 Zones.
[2021-12-03 15:48:01 +0100] information/ConfigItem: Instantiated 7 Services.
[2021-12-03 15:48:01 +0100] information/ConfigItem: Instantiated 1 IcingaApplication.
[2021-12-03 15:48:01 +0100] information/ConfigItem: Instantiated 4 Hosts.
[2021-12-03 15:48:01 +0100] information/ConfigItem: Instantiated 2 NotificationCommands.
[2021-12-03 15:48:01 +0100] information/ConfigItem: Instantiated 1 Endpoint.
[2021-12-03 15:48:01 +0100] information/ConfigItem: Instantiated 1 FileLogger.
[2021-12-03 15:48:01 +0100] information/ConfigItem: Instantiated 235 CheckCommands.
[2021-12-03 15:48:01 +0100] information/ScriptGlobal: Dumping variables to file '/var/cache/icinga2/icinga2.vars'
[2021-12-03 15:48:01 +0100] information/cli: Finished validating the configuration file(s).
Perfect! Now we want to test our configuration in practice.
Start Icinga2 service
First, start Icinga2 service with the following command:
sudo systemctl start icinga2
Next, check the service status:
sudo systemctl status icinga2
Sample output:
  icinga2.service - Icinga host/service/network monitoring system
     Loaded: loaded (/lib/systemd/system/icinga2.service; enabled; vendor preset: enabled)
     Active: active (running) since Wed 2021-12-03 16:07:57 CET; 3min 9s ago
       Docs: https://icinga.com/docs/icinga2/latest/
    Process: 5628 ExecStartPre=/usr/lib/icinga2/prepare-dirs /usr/lib/icinga2/icinga2 (code=exited, status=0/SUCCESS)
   Main PID: 5633 (icinga2)
      Tasks: 18 (limit: 2324)
     Memory: 12.4M
        CPU: 797ms
     CGroup: /system.slice/icinga2.service
             ├─5633 /usr/lib/x86_64-linux-gnu/icinga2/sbin/icinga2 --no-stack-rlimit daemon -e
             ├─5654 /usr/lib/x86_64-linux-gnu/icinga2/sbin/icinga2 --no-stack-rlimit daemon -e
             └─5659 /usr/lib/x86_64-linux-gnu/icinga2/sbin/icinga2 --no-stack-rlimit daemon -e

Dec 03 16:07:57 server icinga2[5654]: [2021-12-03 16:07:57 +0100] information/DbConnection: 'ido-mysql' started.
Dec 03 16:07:57 server icinga2[5654]: [2021-12-03 16:07:57 +0100] information/NotificationComponent: 'notification' started.
Dec 03 16:07:57 server icinga2[5654]: [2021-12-03 16:07:57 +0100] information/CheckerComponent: 'checker' started.
Dec 03 16:07:57 server icinga2[5654]: [2021-12-03 16:07:57 +0100] information/ConfigItem: Activated all objects.
Dec 03 16:07:57 server icinga2[5654]: [2021-12-03 16:07:57 +0100] information/IdoMysqlConnection: 'ido-mysql' resumed.
Dec 03 16:07:57 server icinga2[5654]: [2021-12-03 16:07:57 +0100] information/DbConnection: Resuming IDO connection: ido-mysql
Dec 03 16:07:57 server icinga2[5654]: [2021-12-03 16:07:57 +0100] information/IdoMysqlConnection: MySQL IDO instance id: 1 (schema version: '1.14.3')
Dec 03 16:07:57 server icinga2[5654]: [2021-12-03 16:07:57 +0100] information/IdoMysqlConnection: Finished reconnecting to 'ido-mysql' database 'icinga2' in 0.0624042 second(s).
Dec 03 16:08:07 server icinga2[5654]: [2021-12-03 16:08:07 +0100] information/IdoMysqlConnection: Pending queries: 9 (Input: 3/s; Output: 2/s)
Dec 03 16:09:27 server icinga2[5654]: [2021-12-03 16:09:27 +0100] information/IdoMysqlConnection: Pending queries: 10 (Input: 3/s; Output: 2/s)
Note that the status must be active (running), indicating that the service is up and running.
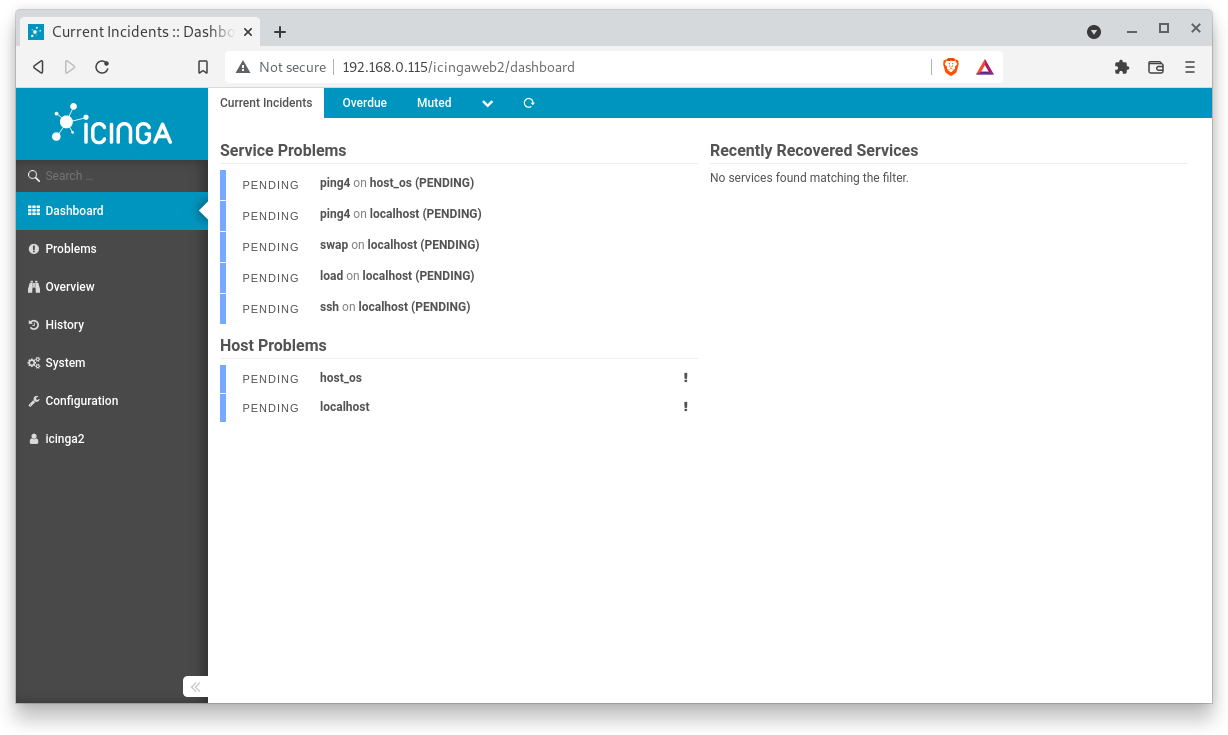
Let's go back to the Icinga Web frontend. You will notice that some check commands are in pending mode. Don't worry about that. Icinga2 needs some time to process the results of the check commands.
Meanwhile, discover the dashboard: (1) Service problems (2) Host problems and (3) Recently Recovered Services. Depending on the status, noticifations are listed in one of the three layout cards.
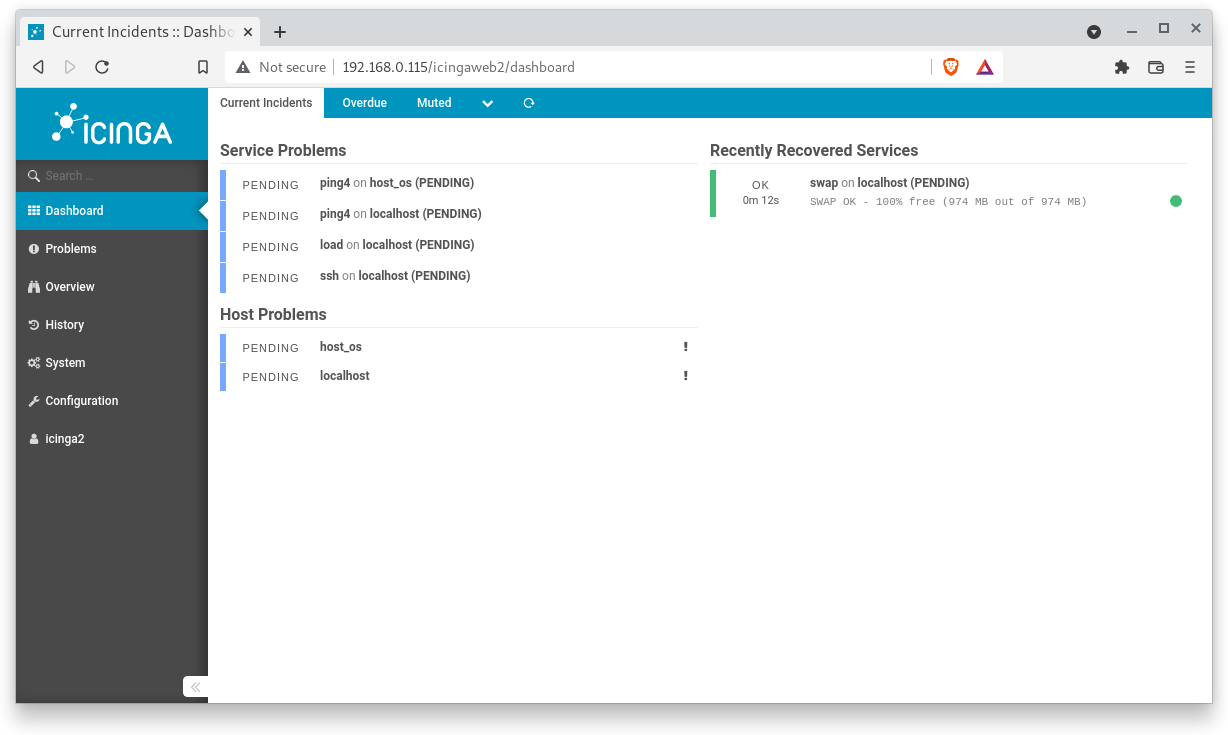
After some time, more and more messages are listed in the "Recently restored services" card.
Finally, all hosts and services operate in normal state. No service or host problems occur.
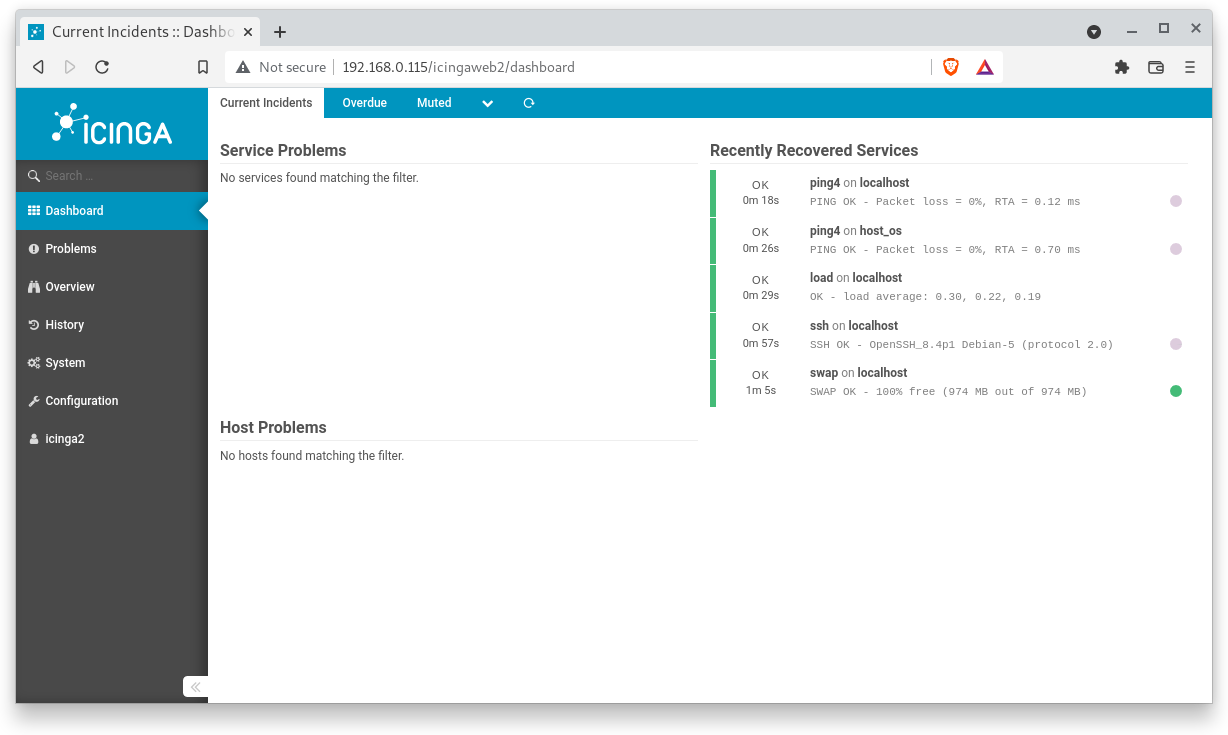
Perfect!
Congratulations !
You have successfully set up your first host for agentless monitoring with standard CheckCommands.